They Came on Waves of Ink
Pacific Northwest Maritime Trade at the Dawn of American Settlement, 1851–1861
Update — May 5, 2021: You can now easily explore the ledger data with Palladio! To get started, see the “Explore for Yourself” section below.
Update — November 14, 2020: The American Society for Legal History has awarded this project the 2020 Mary L. Dudziak Digital Legal History Prize.
Update — October 28, 2020: Research drawn from this project has been published in Current Research in Digital History. See: Sean Fraga, “Digitally Mapping Commercial Currents: Maritime Mobility, Vessel Technology, and U.S. Colonization of Puget Sound, 1851–1861,” Current Research in Digital History 3 (2020).
The Ledger
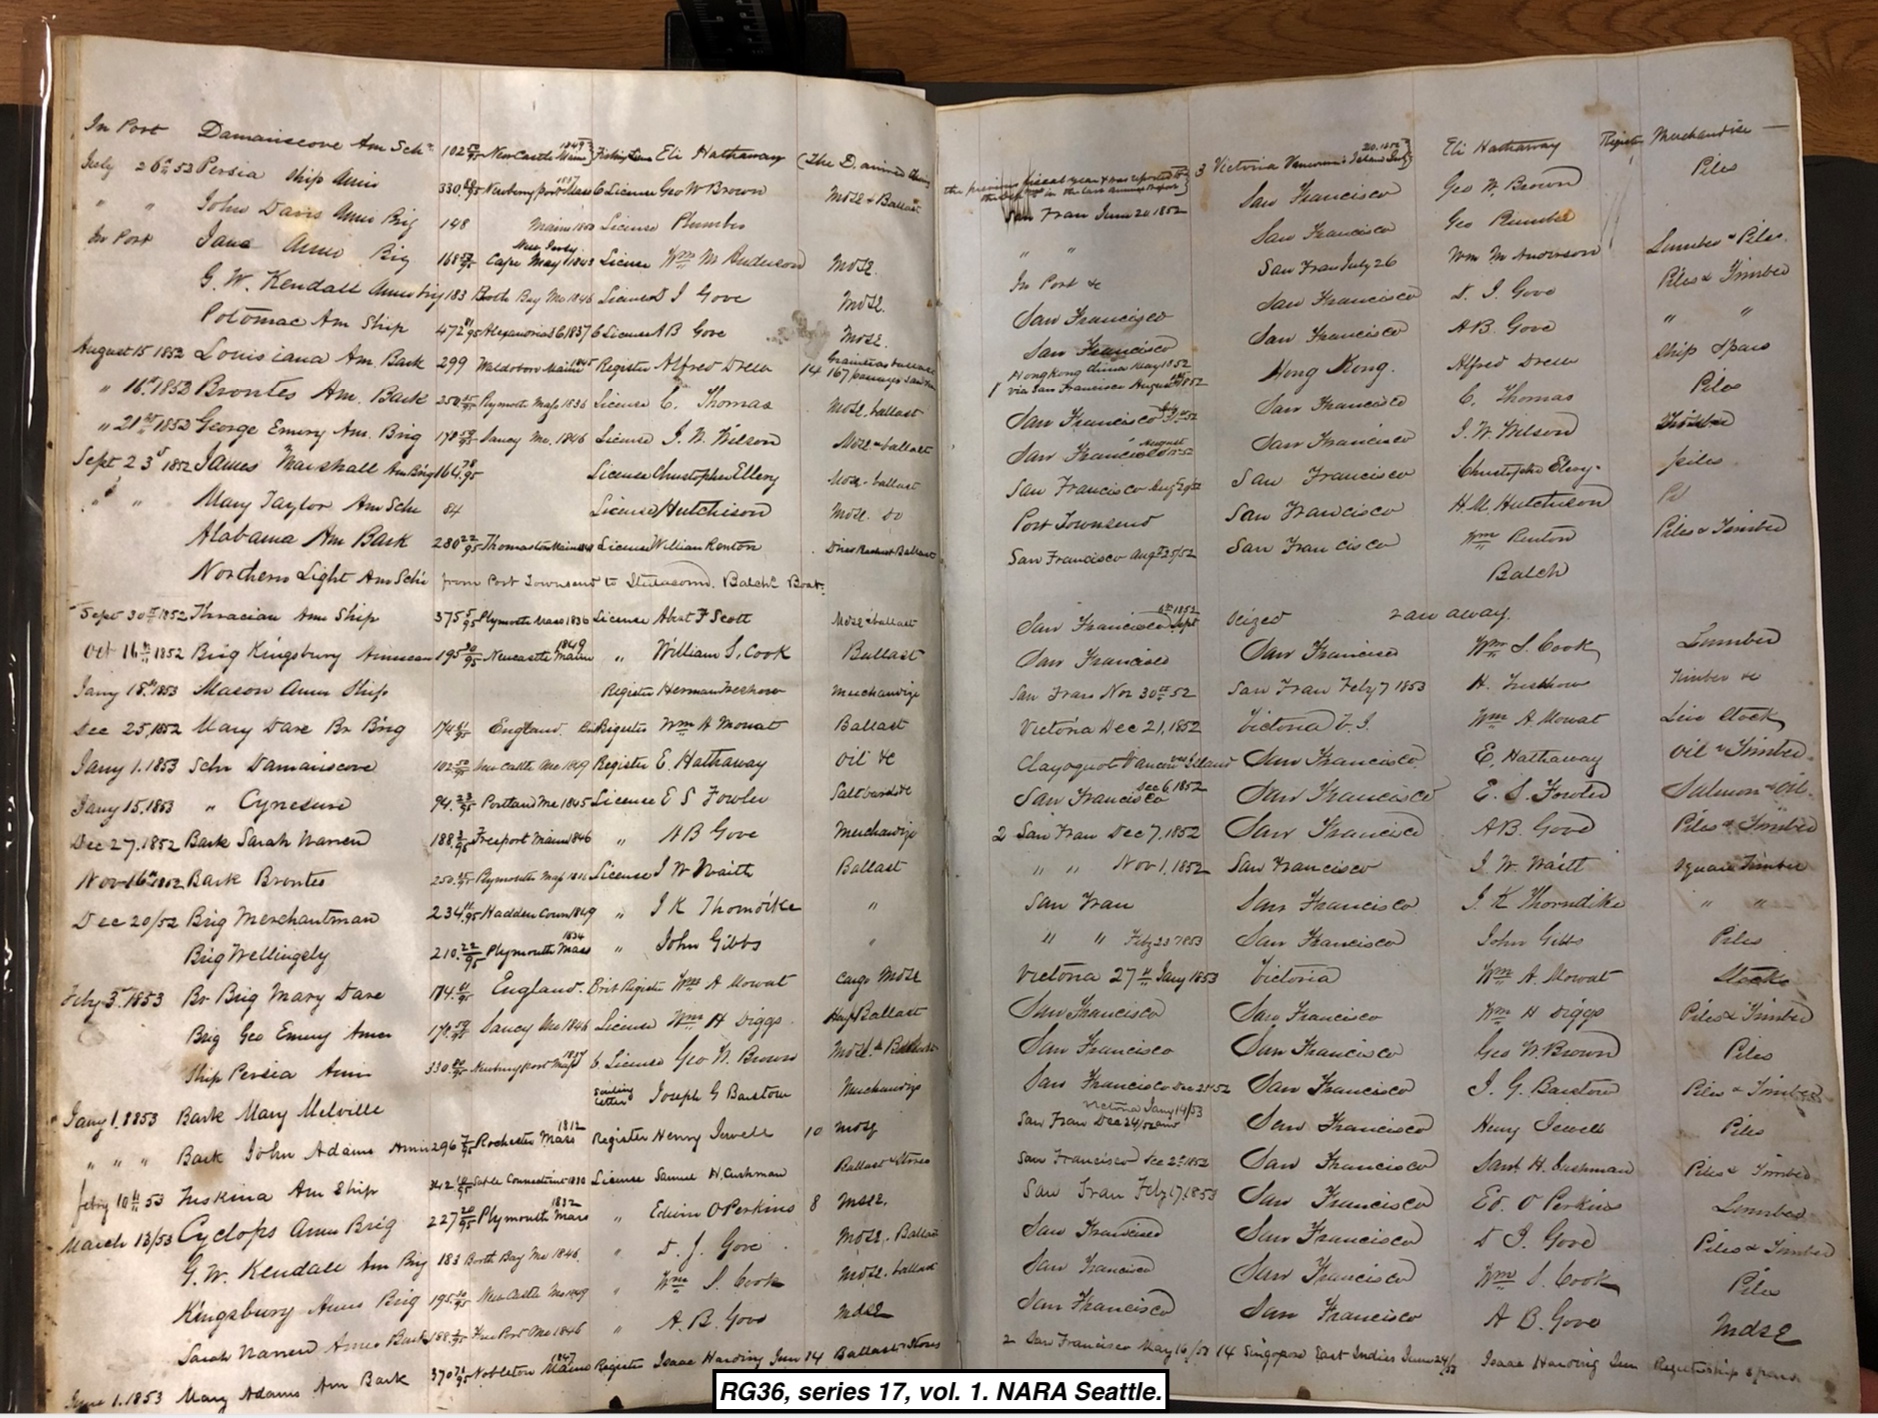
Our story begins with an old book. Many books, like diaries or memoirs or novels, narrate a story by providing us with characters and plot and conflict. But this book is a ledger, containing thousands of handwritten lines of data—a kind of nineteenth-century spreadsheet.
For nearly a decade, U.S. Customs officials used this ledger to record information about vessels arriving and departing the Puget Sound Customs District. Congress created the district in 1851, two years before Washington Territory was carved from the northern half of Oregon Territory. The ledger captures a period of sweeping changes in the Pacific Northwest: the aftermath of the region’s division between Britain and the United States under the 1846 Oregon Treaty, the beginning of sustained non-Native settlement, the spread of logging and sawmills, the treaties imposed by Americans on Indigenous nations and the conflicts that followed, the rush of gold miners to Fraser River, and the beginning of the San Juan Islands boundary conflict, a dispute over the U.S.–British maritime border that would last for the next twenty-five years. The ledger is is both a document and a product of those changes, a window into that world.
Customs officers recorded a wealth of data about every vessel entering or leaving the Puget Sound Customs District. They wrote down information about a vessel’s voyage (when it arrived, where it had sailed from, where it was heading next, when it departed). They registered details about the vessel itself (where it was built, its nationality and registration, its size and type). And they noted who and what was on board (names of masters, headcounts of passengers and crew, brief descriptions of cargo).
But if the ledger is like a window onto the past, then its meticulous lines of data are like blinds, closed and shut tight. There is no plot here, no story; the characters float loose on a non-narrative sea. Digital analysis is a way of curling open the blinds—to see what lies on the other side.
When I requested the ledger at the National Archives facility in Seattle in summer 2018, I knew it had a story to tell. From research for my book project, I knew that many nineteenth-century Americans were interested in the Pacific Northwest for its potential to connect the eastern United States with the Pacific Ocean, and I was curious what connections with Asia would be visible in the ledger. I also knew that this was a decade of significant changes in the Pacific Northwest. Inspired by Richard White’s argument that mapping and visualizing data “is a means of doing research,” I began experimenting.
Supported by a seed grant from Princeton’s Center for Digital Humanities, I worked with two incredible undergraduate research assistants during spring 2019 to transcribe and encode the entries contained within the ledger, as part of my postgraduate work with Princeton’s Department of History. In a sense, we took a physical spreadsheet and translated it into digital form. This website uses maps and data visualizations to reveal the world captured by this ledger—the narrow slice of maritime traffic passing into and out of Puget Sound.
Explore for Yourself
The maps and visualizations below will open the ledger’s world to you. But you can also explore the ledger data yourself with Palladio, a web-based mapping and visualization tool from Stanford’s Humanities + Design research lab. It’s simple: Go to Palladio’s start page, click “Load an existing project” in the sidebar, and paste this link into the text box:
https://seanfraga.github.io/wavesofink/WavesOfInkPalladio.json
Then click “Load” to open the ledger data in Palladio. From here, you can use the Map view to see all the places recorded in the ledger: Just click “New Layer” and select the place types you want to map. Try sizing the points to get a sense of how often different ports appear in the ledger, or try creating a point-to-point map to see the web of links that connected Puget Sound to the wider world. In the Graph view, you might try setting the source to vessel names and the target to port of origin, in order to see how different vessels cluster in association different ports, like Port Townsend, Victoria, or San Francisco. You can use the Table view to create a custom table view of the ledger data. Check out Palladio’s Tutorials and FAQs page to get a sense of other possibilities.
The ledger data is public because there is far more here than I can analyze alone. The transcription of the original ledger is freely available in my repository on GitHub, and a photographic copy of the ledger is freely available as a PDF on my Google Drive (warning: it’s a large file!). I invite you to work with the data yourself, and to get in touch with me to share your ideas, questions, and analysis. What will you discover?
The World…
 This map shows all the ports linked to the Pacific Northwest by maritime trade between 1851 and 1861. Purple circles represent origin points (as reported by inbound vessels) and yellow triangles represent destinations (for outbound vessels). The Northwest was connected to a spread of destinations around the Pacific Ocean, from Peru to Hawaii to China, as well as to a few key points in the Atlantic Ocean, including Boston and London.
While this map shows the extent of maritime links, it does a poor job of representing the number of journeys made between these different ports—all these points look the same. So to represent how maritime trade changed over time, I made a series of maps, one for each full year captured in the ledger, and linked the size of the points on the map to the number of voyages. Fewer voyages meant smaller circles and triangles; more voyages meant larger points.
At first, doesn’t seem to be much of a pattern in these maps. But one starts to emerge after 1856, as the symbols representing trade between Puget Sound and Victoria get bigger and bigger, eventually overwhelming the rest of the Pacific Coast. This is gold-rush traffic: the 1858 Fraser River gold rush brought thousands of people to the Pacific Northwest, and a corresponding increase in travel and trade between Port Townsend, the American port of entry, during this period and Victoria, the British port of entry.
…and the Pacific Northwest
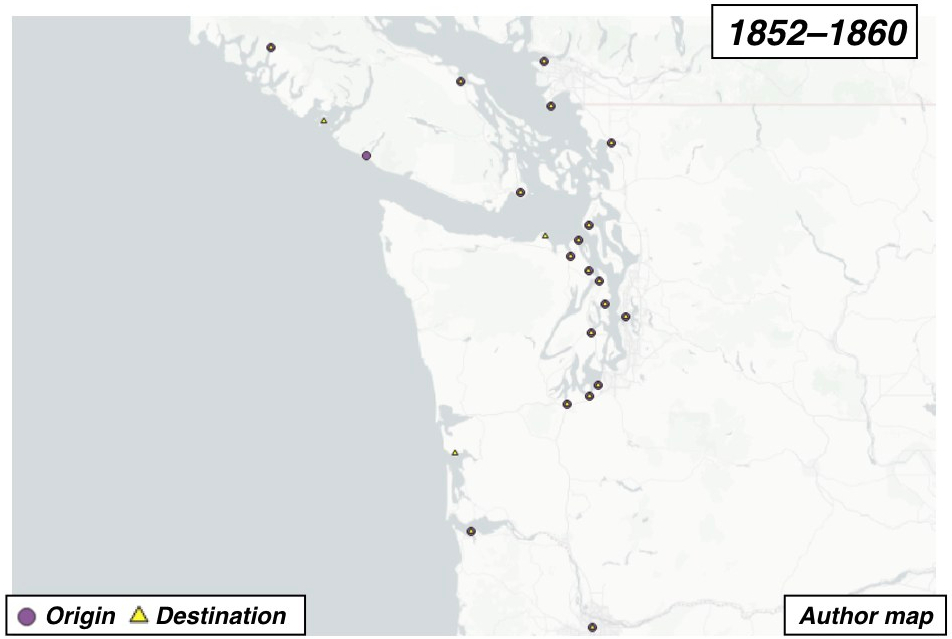
This map shows all the Pacific Northwest ports that appear in the ledger between 1851 and 1861. They include roughly a dozen American ports around Puget Sound as well as several British ports on Vancouver Island and on the British North American mainland. Taken together, these ports show how a dense network of maritime connections spread over Pacific Northwest inland waters.
These maps, one for each year between 1852 and 1860, use differently-sized symbols to show how the number of voyages changed over time. Again, the volume of gold-rush traffic to and from Victoria grew larger and larger after 1856. Gold-rush traffic ended up crowding out other trade: By 1860, there were about five hundred and sixty round trips between Port Townsend and Victoria—roughly one and a half trips a day—and no international trips to or from the many Puget Sound ports recorded in the ledger just a year or two before. This level of cross-border trade between Victoria and the American ports in Puget Sound continued after the gold rush ebbed, and these close economic ties later ended up fueling an annexation movement in Victoria and on Vancouver Island.
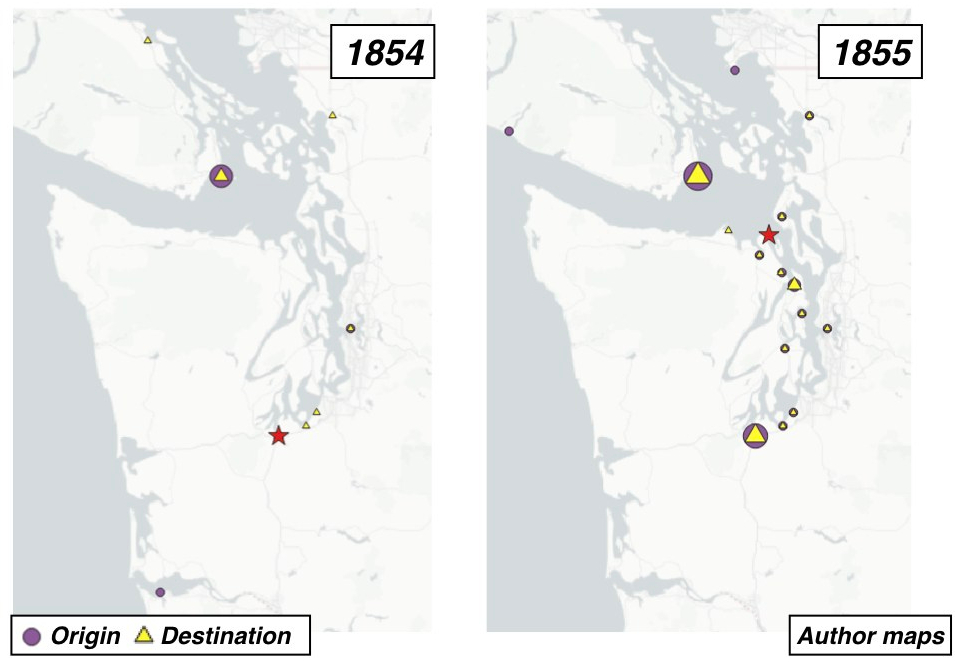 It’s important to recognize, though, that there’s a lot about this period that the ledger didn’t capture (on which more below). These two maps, for example, show origins and destinations, sized by number of trips, for 1854 and 1855. Here, the red stars indicate the location of the customs house, which was first located in Olympia, the territorial capital, at the southern end of Puget Sound. In 1854, the customs house was moved to Port Townsend, a much more central and convenient location. The impact is immediately apparent: Suddenly, a whole new set of ports pop onto the map. These are mostly sawmill ports along the west side of Puget Sound, all of which were shipping out lumber before 1855. These maps show how moving the customs house to a more convenient location affected the voyages that entered the historical record.
The Voyages
During this period, Customs officials recorded roughly four thousand five hundred arrivals and departures. Charting the regions where these voyages originated or terminated shows how Puget Sound was connected to regional and global space during this period, and how those connections shifted over time.

In 1852 and 1853, the vast majority of voyages into or out of the Puget Sound Customs District were coastal ones, with ships coming from or heading to San Francisco, Victoria, or Haida Gwaii (formerly Queen Charlotte’s Islands). San Francisco was rebuilding from a catastrophic 1851 fire while still also dealing with the influx of gold seekers, and its merchants sought lumber and building supplies in the Pacific Northwest. Haida Gwaii experienced a brief gold rush of its own in 1852. Connections to California and Victoria remained a consistent feature of this period, while other Pacific Coast destinations, such as Astoria and Portland, Oregon, saw only a handful of trips.
After 1854, links to the wider Pacific Ocean become evident, with voyages to or from the Hawaiian Islands (Honolulu and Hilo), Asia (Australia, China, Hong Kong, and Singapore), and Central and South America (Mexico, Peru, Chile). There were fewer connections to the Atlantic World. The ledger records only three inbound trips from the U.S. East Coast, all from Boston, and just one outbound trip, to Hampton Roads, Virginia. Of the ten trips to or from Europe, nine trips were to or from England, with one voyage to France.
But this chart’s overwhelming trend—as in the maps above—is the 1858 Fraser River gold rush. This caused significant growth in traffic between the Puget Sound Customs District and the British Northwest, principally Victoria, and roughly doubled the number of annual sailings between Puget Sound and American ports along the Pacific Coast.
While the number of annual voyages shows overall geographic trends, plotting the individual voyages reveals insights about the swarms of vessels themselves.
The Vessels
For each voyage, Customs officials recorded details about each arriving and departing vessel. One key piece of information is a vessel’s tonnage, a measure of its freight capacity and a rough proxy for its size. (A small sloop might be able to carry three or five tons, while a large ocean-going steamship during this period might have a capacity of between a thousand and fifteen hundred tons.) Plotting every arrival and departure by tonnage reveals how commercial currents flowed through Puget Sound and how the types of vessels plying those currents shifted over time.
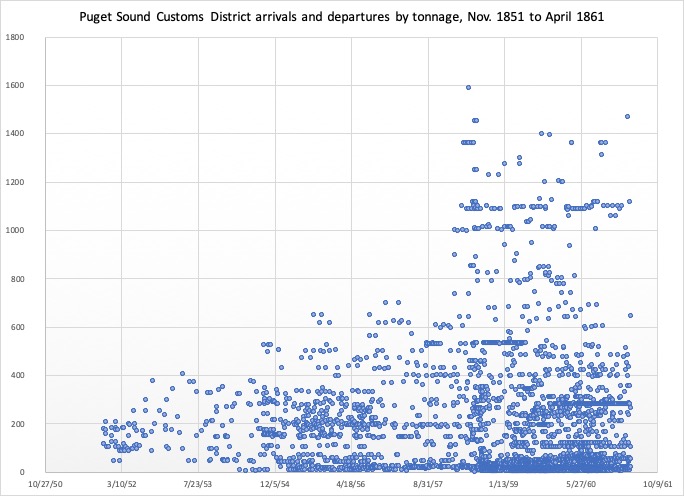
This chart shows the tonnage of every vessel arriving and departing Puget Sound Customs District between November 1851 and April 1861, the span covered by the ledger. Again, traffic related to the Fraser River gold rush jumps out of the data: The spike in tonnage in early 1858 represents large ships, many from San Francisco, carrying passengers to Puget Sound. The relocation of the customs house from Olympia to Port Townsend is also apparent in late 1854, after which the density of voyages recorded increases. Other events seem to barely register, such as the Puget Sound Indian War during the winter of 1854–55: This was less a war than a series of scattered conflicts between American settlers and some of the region’s Indigenous peoples, but it does not seem to have affected shipping. The relative sparseness of voyages recorded during 1857 invites further research.
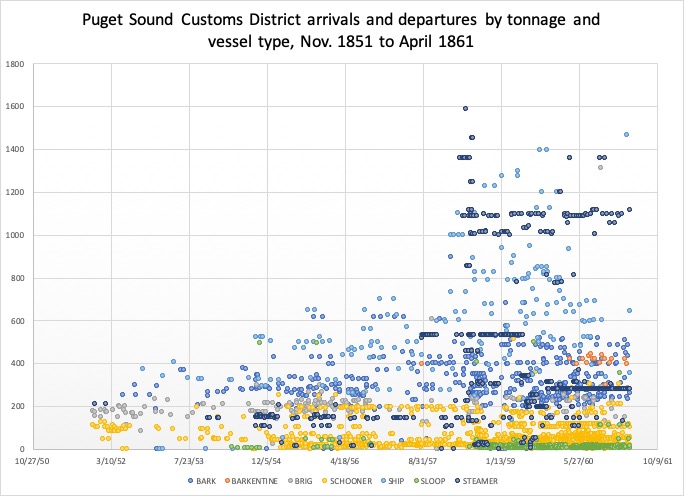
Customs inspectors also recorded the type of vessel, classifying them as barks, barkentines, brigs, schooners, ships, or sloops (all sailing vessels of different sizes and sail configurations), or as steamships (“steamers”). Color-coding the data by vessel type shows the close relationship between a sailing ship’s size and the way its sails were rigged and arranged, from small sloops (green dots) and schooners (yellow), to large ships (light blue). Surprisingly, despite the substantial increase in larger vessels visiting the Puget Sound Customs District during the Fraser River gold rush, average overall tonnage actually decreased during this decade. For every large ship carrying gold-rush passengers, countless smaller vessels began swarming over Puget Sound’s waters.
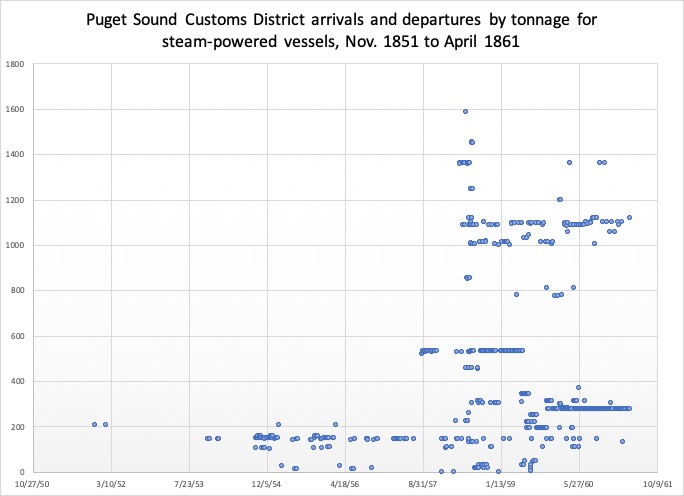
Color-coding also reveals several long horizontal bands of blue dots, representing regular trips by individual steamboats and steamships. Like a vessel’s name, tonnage was a consistent and particular characteristic. The American steamship Constitution, for example, had a tonnage of 533, a tonnage shared by no other vessel in the ledger. Because of this, tonnage can serve as a rough proxy for individual vessels.
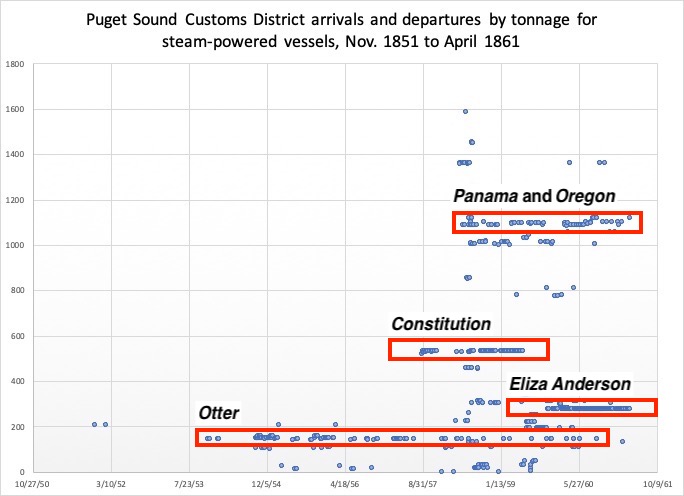
The regular trips of five steamships are particularly evident. The Hudson’s Bay Company steamboat Otter (tonnage 144) had a particularly long term of service, with its earliest trips recorded in November 1853 and its latest September 1860. The American steamboat Eliza Anderson (tonnage 279) saw consistent service, with trips into or out of Port Townsend every few week or so, between June 1859 and April 1861; it is one of the last departures recorded in this ledger. The steamships Panama (tonnage ~1087) and Oregon (tonnage ~1099), connected Puget Sound with San Francisco, sometimes sailing via Victoria. These regular patterns of service served to link Puget Sound ports to Victoria and San Francisco, drawing them closer together.
Update — October 28, 2020: For a more detailed discussion of the settlers’ differing uses of sail- and steam-powered vessels, see: Sean Fraga, “Digitally Mapping Commercial Currents: Maritime Mobility, Vessel Technology, and U.S. Colonization of Puget Sound, 1851–1861,” Current Research in Digital History 3 (2020).
The Blank Spaces
 Despite the richness of these data, there is much about this period that the ledger doesn’t fully capture—stories that appear indirectly or not at all.
Most importantly, the ledger did not record the region’s Indigenous maritime trade networks. Native peoples in the Pacific Northwest and along the Northwest Coast had long utilized the waters as a connective space for both local and long-distance trade. These networks predated the arrival of white traders and settlers and they continued to grow and change during this period. Although American officials, concerned about British influence, attempted to use treaties with Indigenous nations to stop cross-border trade, several tribal nations with ties to both sides of Juan de Fuca Strait, including Makahs and S’Klallams, continued to visit Victoria and Vancouver Island. At the same time, settlers’ need for laborers—especially in the new sawmills—encouraged Northwest Coast Indigenous peoples to incorporate the Puget Sound region into their annual migrations, working, trading, and raiding along the way. Whatever their origin or destination, the voyages of Indigenous pullers were not recorded in the ledger.
Since customs officials generally only recorded a vessel’s original port of departure, any additional stops during the voyage did enter the ledger. This meant that a vessel listed in the ledger as traveling from Olympia to Victoria might have sailed directly, or it might have stopped along the way at Steilacoom, Seattle, Port Madison, Port Townsend, Port Gamble, or other ports—as the Eliza Anderson and other local steamboats commonly did. And since the ledger recorded only vessels entering or leaving the Puget Sound Customs District, domestic trade entirely within the district is left invisible. This meant that trips between two Puget Sound ports—from Olympia to Seattle, for example—did not appear in the ledger.
Curiously, this means that evidence of the San Juan boundary conflict—one of the most significant historical events of this period—does not appear at all in the ledger. That dispute, also known as the Pig War, is abundantly recorded in government correspondence, early newspapers, and pioneer reminiscences, especially after it broke into open conflict in summer 1859. In June 1859, an American settler (and failed Fraser River gold miner) on San Juan Island shot a British pig that had been rooting in his garden; by August 1859, both the United States and Britain had rushed hundreds of troops to the island and established military camps. But because the United States saw the San Juan Islands as American territory throughout this period, vessels calling there were not required to enter or clear at the customs house—and so their voyages were not recorded in the ledger. Smuggling is similarly absent from the ledger, since, by its very nature, smuggling relies on evading state authorities like Customs officials.
There are also structural limitations to representing data in the ledger’s narrow rows and columns. In order to create consistent data, Customs officials sometimes sheared off the rough edges of lived experience, leaving only hints of the complexities they encountered. In one of his first official actions, for example, the district’s first Customs inspector, Simpson P. Moses, nearly provoked an international incident between Britain and the United States in 1851, when he seized two British ships—the Hudson’s Bay Company steamboat Beaver and the British brig Mary Dare, which the Beaver was towing—on the pretext of violating American import regulations. This story is not recorded in the ledger, which only indicates the two vessels arrived from Victoria in late November 1851, and departed for Victoria in early February 1852, each with a cargo of “Live Stock (Cattle & Sheep).” Or consider the American ship Thracian, which reached Olympia from San Francisco on September 30, 1852. Beside its arrival entry is a scribbled note: “Seized, ran away.” (This note is visible in the first image on this page, about halfway down on the right-hand side.) Surely there is a larger story there—but it is not in this particular book.
The ledger records the voyages of numerous vessels significant to this period of the region’s history, such as the November 1851 arrival of the American schooner Exact, which carried the Denny party, a group of American settlers who helped found the city of Seattle. But this voyage was given no special significance in the ledger. The Exact was just another ship, inbound from Portland, Oregon, with a crew of six and fifty-four passengers aboard.
In some ways, this is the promise of a data-driven project. Looking at thousands of voyages in the aggregate turns our attention away from the significant, the important, the charismatic—the usual subjects of histories. Instead, it reorients us to the larger currents of movement and exchange that shaped this place and this period.
The Ledger and the Data
The data that underpins this project has a story of its own. The ledger journeyed thousands of miles to reach the Pacific Northwest, then was taken at gunpoint, swept out to sea, lost, found, and eventually came to rest in a federal warehouse. The data’s journey from page to screen was less dramatic, but equally important.
Moses, the district’s first customs inspector, brought the physical ledger with him from Philadelphia. (The bookplate of William H. Maurice, stationer, 108 Chestnut Street, is still pasted into the front cover.) Many hands and many pens touched the ledger over the next decade, until April 1861, when the ledger recorded its last departure (the schooner Flying Mist, heading to Victoria, B.C.). For the next year or so, Customs officials stored the ledger at Port Townsend with other records. Until Victor Smith arrived.
Smith, the new Collector of Customs, sailed into Port Townsend’s harbor in August 1862 aboard U.S.S. Shubrick, a lighthouse tender, and ordered the ship’s three cannons trained on the Port Townsend customs house. Smith had been appointed customs collector a year earlier and quickly began working to move the customs house from Port Townsend to Port Angeles, where he owned land. Under threat of bombardment, the acting customs inspector released the records to Smith, who loaded them aboard the Shubrick and sailed for Port Angeles, where he stored the ledger and other customs records in a strongbox in the new customs house.
The following winter, a landslide in the mountains above Port Angeles created a natural dam—which soon failed. On December 16, 1863, a flood of water tore the customs house from its foundation and swept it out into Juan de Fuca Strait. A group of Makahs found the wreckage and forced open the strongbox, took the money and gold within, and threw the records away. The ledger and some other materials were later recovered. Smith was subsequently removed from his position. His replacement moved the customs house back to Port Townsend in 1865. The ledger returned to Port Townsend with other records aboard the Shubrick, where residents greeted it with celebratory cannon fire.
In 1913, as part of a national reorganization of customs districts, the federal government moved the Puget Sound Customs District headquarters from Port Townsend to Seattle. The recovered ledger was packed up and shipped to Seattle, along with fifty tons of customs records, furniture, and office accessories, and stored on the second floor of Seattle’s Federal Building, a block from the waterfront. The ledger was later transferred, with other old records, to the National Archives and Records Administration facility in Seattle, where it formed part of Record Group 36.
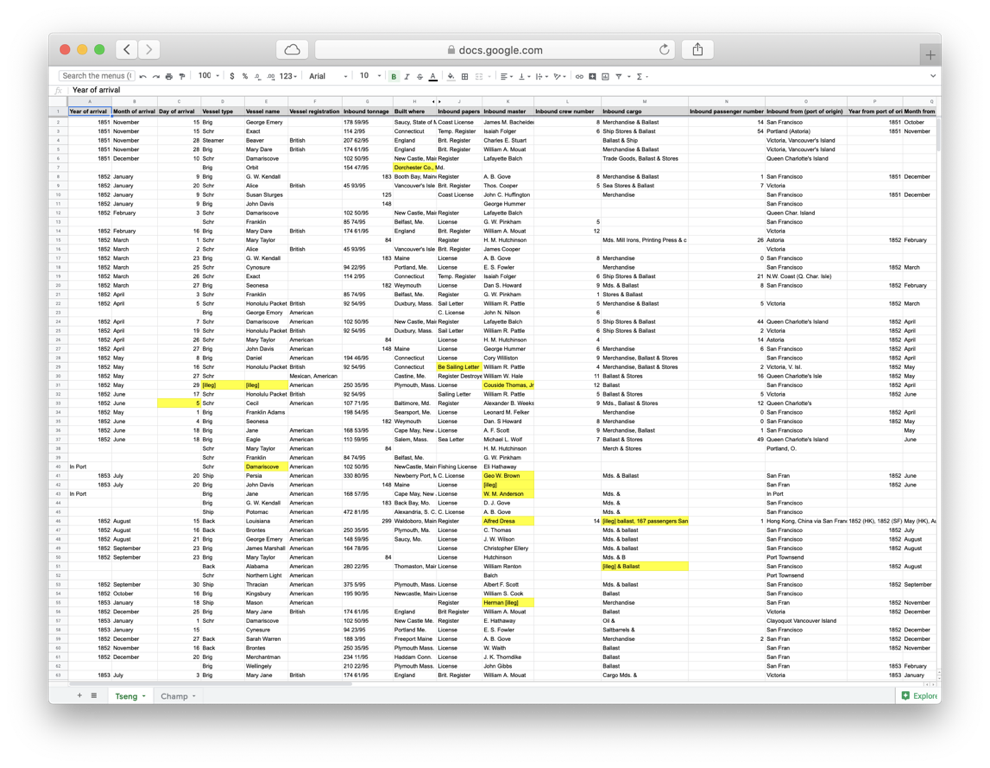
And there it sat, except when requested by visiting researchers. I was one such researcher: I took digital photos of each page and compiled them into a PDF. Over the year that followed, I worked with two undergraduate research assistants to transcribe each line into Google Sheets, then to verify each entry. This is only the latest turn of events for a ledger that is more than a century and a half old.
The resulting data is publicly available through my repository on GitHub. Maybe you’re looking for an ancestor’s ship, or maybe you want to know what freight all these vessels carried. I invite you to undertake your own experiments and to let me know what you discover.
The Scholarly Conversation
Like Puget Sound itself, the ledger mediates between two regions: The North American West and the Pacific Ocean. These areas are usually studied separately, but I find the ledger interesting because scholars in both fields have asked similar questions about how and why U.S. interest in North America’s Pacific Coast shifted—slowly and then suddenly—at the middle of the nineteenth century.
Western historians have long been interested in the federal government’s role in supporting, encouraging, and directing territorial expansion. Richard White famously described the West as “the kindergarten of the American state, a place where federal government nurtured its power and produced its bureaucracies.” Similarly, Anne Hyde, in Empires, Nations, and Families, pointed to the “scaffolding of American conquest—railroads, armies, surveyors, reservations, censuses, and law,” that undergirded U.S. territorial expansion. This Customs ledger, created and maintained by federal employees charged with administrating the nation’s borders and collecting the duties that constituted the bulk of the nation’s nineteenth-century revenue, represents a specific, tangible instantiation of the federal government’s presence in the West.
But the ledger is more than a Western document; it reaches into and across the Pacific Ocean. Pacific scholars see the middle of the nineteenth century as a turning point. David Igler (another scholar straddling the West and the Pacific), closes his study, The Great Ocean, with the 1848 California gold rush, writing that the gold rush marked the start of a period when the United States consolidated its Western territories, turning the eastern Pacific rim into the American West. Similarly, Matt Matsuda writes in Pacific Worlds about how “trans-local” places—specific local sites that came to host global connections—emerged in new numbers across the Pacific Ocean during this period. This ledger offers insight into those processes—and how maritime trade and maritime borders could intertwine and overlapp.
I discuss some of this project’s historiographic questions more fully, especially related to the role of steam power in Pacific Northwest development, in: Sean Fraga, “Digitally Mapping Commercial Currents: Maritime Mobility, Vessel Technology, and U.S. Colonization of Puget Sound, 1851–1861,” Current Research in Digital History 3 (2020).
In using digital methods to answer these questions, this project contributes to a surprisingly long tradition of computer-assisted historical interpretation. Historians first used computers to analyze shipping records in the 1950s, laboriously coding punch cards and feeding them into IBM tabulators and calculators. In 1958, two economic historians, J. R. T. Hughes and Stanley Reiter, published a quantitative analysis of the early British steamship fleet, entitled “The First 1,945 British Steamships,” in the Journal of the American Statistical Association. The following year, Bernard and Lotte Bailyn published Massachusetts Shipping, 1697–1714: A Statistical Study, using computational analysis to bring fresh insight to a colonial document familiar to many scholars.
The Bailyns found digital work “full of unexpected problems whose solutions were exceedingly time consuming and not always completely satisfying.” At one point in the project, a bent wire in an IBM sorting machine caused 4,725 of their punchcards to be mis-sorted. These frustrations will be broadly familiar to scholars using digital methods today—even if we no longer have to worry about wires and punchcards.
Historians continue to use digital methods to produce stand-alone works and enrich larger projects. Benjamin Schmidt, for example, used data compiled by Matthew Fontaine Maury to produce maps of the ghostly tracks left behind by American ships sailing the world’s oceans between 1785 and 1860. David Igler used archival shipping data in the first chapter of The Great Ocean to track California coastal trade during a similar period.
Where mid-twentieth-century historians working digitally—the punchcard pioneers— were largely limited to statistical analysis (basically, counting and comparing), advances in computer hardware and software have made it possible to interpret the data in these sources with a new fluidity and richness. A project like “Waves of Ink” shows how easy it now is to do this kind of work. The basic transcription and data preparation was done in less than a semester; the tools used to analyze and interpret the data are relatively simple, widely available, and often cheap or free. The “Waves of Ink” project thus offers a model for analyzing and interpreting non-narrative data in archival ledgers, logbooks, and account records.
Publications and Speaking Engagements
So far, research drawn from this project has been published in Current Research in Digital History. I’m also incorporating insights from this research into my book project.
Sean Fraga, “Digitally Mapping Commercial Currents: Maritime Mobility, Vessel Technology, and U.S. Colonization of Puget Sound, 1851–1861,” Current Research in Digital History 3 (2020).
I am grateful to the organizations and institutions that have invited me to share this research as the project developed, including at Johns Hopkins, the University of Florida, the American Philosophical Society, and the German Historical Institute. If you’re interested in having me speak at your campus, museum, or other institution about this project or my broader digital humanities research, please get in touch.
- “They Came on Waves of Ink: Digitally Mapping Pacific Northwest Maritime Trade Networks During American Settlement, 1851–1861,” at the Digital History Workshop, co-sponsored by the Modern America Workshop, hosted by the Department of History, Johns Hopkins University, over Zoom, on March 26, 2021.
- “Digitally Mapping Commercial Currents: Narrating a U.S. Customs Logbook with Digital Humanities Tools,” as part of the U.S.C. Center for Law, History and Culture workshop series, hosted by the Gould School of Law at the University of Southern California, via Zoom, on Wednesday, March 10, 2021.
- Class visit: I discussed “They Came on Waves of Ink” (along with my Western Historical Quarterly article, “‘An Outlet to the Western Sea’: Puget Sound, Terraqueous Mobility, and Northern Pacific Railroad’s Pursuit of Trade with Asia, 1864–1892”) with James Gerien-Chen’s “Pacific Empires and Migrations” senior history seminar at the University of Florida, over Zoom on February 10, 2021.
- “They Came on Waves of Ink: Digitally Mapping Pacific Northwest Maritime Trade Networks During American Settlement, 1851–1861,” at the American Philosophical Society, over Zoom on May 19, 2020.
- “Using Digital Mapping to Illuminate Non-Narrative Sources,” Data Conversations in History, organized by the Center for Digital Humanities and hosted by the Department of History, Princeton University, April 11, 2019.
- “Digital Visualizations of Pacific Northwest Maritime Trade Networks During American Settlement, 1851–61,” as part of “Six Shooters: A Digital Frontiers Lightning Round” at the Western History Association 2019 annual conference, Las Vegas, Nev., October 17, 2019.
- “Stories in a Muddy Ledger: Narrating a Non-Narrative Source with Digital Humanities Tools” (invited paper), “Digital Hermeneutics: From Research to Dissemination” conference, German Historical Institute, Washington, D.C., October 11, 2019.
- “Mapping Pacific Northwest Maritime Trade Networks During American Settlement, 1851–61,” North American Society for Oceanic History 2019 annual conference [schedule], New Bedford, Mass., May 16, 2019.
Acknowledgements and Citations
My thanks to Princeton’s Center for Digital Humanities. A CDH Seed Grant enabled me to hire two undergraduate research assistants, Charlotte Champ and Tammy Tseng, to transcribe the data; their work was invaluable. Nora Benedict (now at the University of Georgia) and Rebecca Munson offered guidance and suggestions as I was starting this project. Everyone at the CDH got this project, and their support and enthusiasm helped me chart a route and set sail.
My thanks to Princeton’s Dean of the Graduate School, which awarded me a Dean’s Completion Fellowship and hired me as a postgraduate research associate affiliated with the Department of History and the Center for Digital Humanities during Spring/Summer 2019.
My thanks to the Humanities in a Digital World program at the University of Southern California, particularly the community of graduate fellows, postdoctoral fellows, faculty, and staff formed through our workshops and reading groups. Our discussions have shaped and nuanced my thinking.
The ledger may be cited as: “Registers of Entrances and Clearances of Vessels, Nov. 1851 – April 1861,” RG36, series 17, vol. 1, National Archives and Records Administration, Seattle.
This project website may be cited as: Sean Fraga, “They Came on Waves of Ink: Pacific Northwest Maritime Trade at the Dawn of American Settlement, 1851–1861,” last modified May 6, 2021, https://seanfraga.com/wavesofink/.
